


Two goalkeepers finish a season with near-identical save percentages, and one of them gets linked with a move to a stronger club while the other is quietly released. The number that supposedly measures the same thing for both of them was, on closer inspection, measuring two very different jobs: one keeper faced a stream of low-quality speculative efforts behind a dominant defence, the other faced a smaller number of clean, high-quality chances behind a defence that could not clear its lines.
Recruitment departments that rely on a single season’s raw save percentage to shortlist candidates are, in effect, letting the quality of a target’s current defence quietly decide who gets scouted next, an outcome none of them would accept if it were stated in those terms during a transfer committee meeting.
Save percentage rewards keepers behind good defenses almost as much as it rewards good goalkeeping itself, and treating the raw number as a clean measure of shot-stopping ability routinely misjudges keepers on both sides of that divide. The stat is not wrong; it is answering a narrower question than the one people usually ask of it.
This piece explains the limitation, introduces the shot-quality-adjusted alternative that has become standard among analysts, and sets out what to actually check before judging a keeper on a season’s raw numbers.
None of what follows argues that raw save percentage is worthless. It is a fine, quick indicator when comparing keepers who genuinely faced a similar volume and quality of shots, and the problem only becomes serious once it is used to compare across very different defensive contexts without any adjustment at all.
- The core flaw: save percentage does not adjust for how difficult the shots faced actually were
- The fix: post-shot expected goals compares a save against the quality of the shot it stopped
- Its own limit: post-shot models still struggle with unusual angles, deflections and low sample sizes
- What to check first: shot volume, shot quality faced, and defensive structure in front of the keeper
Why save percentage rewards keepers behind good defenses
Save percentage rewards keepers behind good defenses because a strong defensive structure suppresses the number and the quality of chances a keeper actually faces, leaving a disproportionate share of remaining shots as low-probability, speculative efforts from distance or tight angles that were always likely to miss the target or be saved regardless of who stood in goal. A keeper facing mostly these shots posts an inflated save percentage that reflects the defence in front of them as much as their own reflexes.
The reverse distorts things just as badly. A keeper behind a leaky defence faces a higher proportion of clean, high-quality chances, one-on-ones and close-range headers, that are difficult to save regardless of technique, dragging the raw percentage down even for a keeper performing well relative to the shots actually faced.
League context adds a further layer of distortion when comparing across competitions rather than within one. A league with generally weaker finishing produces easier average shots faced across the board, inflating save percentages league-wide in a way that has nothing to do with the goalkeeping standard in that competition relative to another.
What the raw number does not know
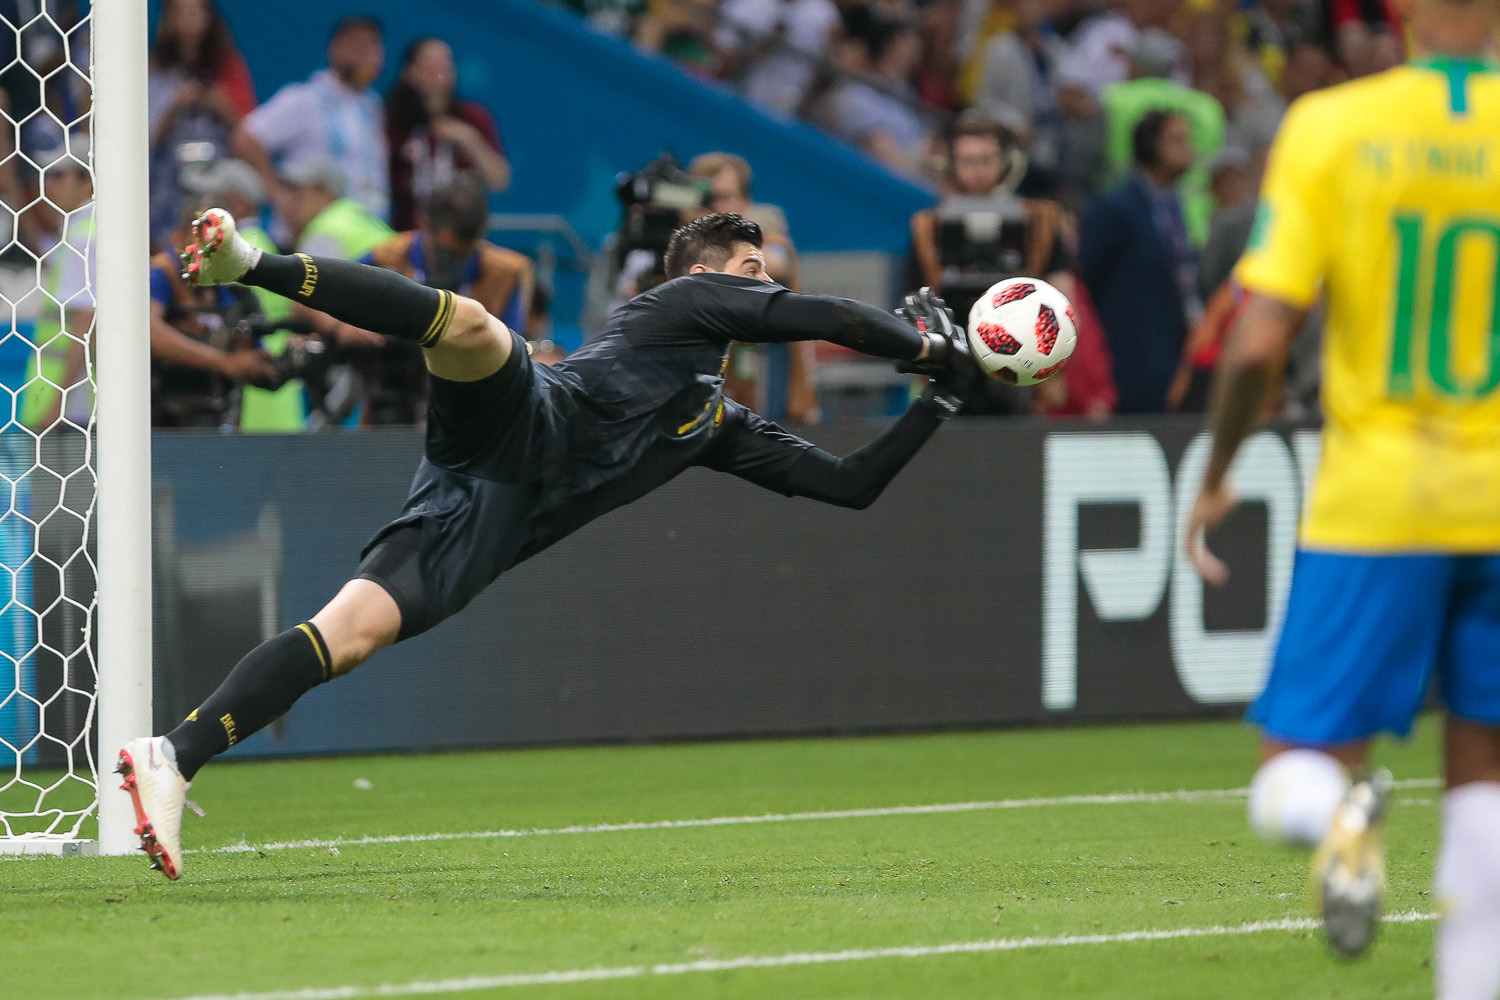
A basic save percentage treats every shot faced as equally difficult, counting a routine catch from a tame long-range effort the same as a reflex save from a point-blank header. This flattening is the core problem, because the two situations demand entirely different levels of skill, and a keeper’s actual performance can only be judged fairly once that difference is accounted for.
The number also says nothing about a keeper’s contribution beyond stopping shots directly, distribution under pressure, commanding crosses, organising a defensive line, all of which affect a team’s results without ever showing up in a save tally.
Shot location adds another layer the raw count ignores entirely. A save from a tight angle near the byline is mechanically a very different task from a save on a shot struck cleanly from the penalty spot, yet a basic save percentage counts both as identical outcomes provided the ball did not cross the line, collapsing genuinely distinct goalkeeping challenges into a single undifferentiated tally.
Introducing post-shot expected goals

Post-shot expected goals assigns each shot on target a probability of being scored based on factors known at the moment the shot was struck, its placement, power and trajectory, then compares the sum of those probabilities against the goals actually conceded. A keeper who concedes fewer goals than the model expects given the shots faced is outperforming the quality of chances against them; one who concedes more is underperforming it, regardless of what the raw save count shows.
This reframes the question from “how many shots did the keeper stop” to “how many of the goals a typical keeper would have conceded from these exact shots did this keeper prevent,” which is a fairer basis for comparing keepers who face very different volumes and types of shots across a season.
Goalkeeper post shot xg corrects for the shots a keeper actually faced
Because goalkeeper post shot xg is calculated shot by shot rather than averaged across an entire season upfront, it naturally accounts for a keeper who faces an unusually difficult run of shots in one stretch of the season and an easier run in another, smoothing out exactly the kind of defensive-context distortion that a simple save percentage cannot separate from genuine shot-stopping skill. A keeper who consistently beats their expected-goals-conceded total across a full season is demonstrating a real, repeatable shot-stopping edge rather than benefiting from a favourable run of low-quality shots faced.
Clubs that have adopted this metric internally generally use it alongside, not instead of, traditional scouting footage, because the number identifies who is outperforming expectation but does not on its own explain the technical habits producing that outperformance.
Where the model itself struggles
Post-shot expected goals models are trained on large datasets of previous shots and typically handle common situations, open-play efforts from a clear sight of goal, reasonably well. They are considerably less reliable for deflected shots, where the ball’s trajectory changes suddenly in a way the pre-deflection data cannot predict, and for unusual angles and set-piece scrambles where the shot sample the model was trained on is comparatively thin.
Small sample sizes compound this weakness at club level. A single deflected own-goal or a fluke long-range strike can swing a keeper’s seasonal expected-goals-conceded comparison meaningfully in a way that a much larger sample, such as a full international season across multiple leagues, would absorb without much distortion.
Different providers also build their post-shot models on different underlying shot datasets and weighting assumptions, which means a keeper’s expected-goals-conceded figure can vary noticeably between two reputable analytics providers looking at the exact same matches. This is worth checking before citing a single provider’s number as if it were an agreed, objective fact rather than one reasonable model among several.
What to check before judging a keeper’s season
Before drawing a conclusion from either raw save percentage or the adjusted expected-goals version, it helps to check three things separately: total shot volume faced, since a small sample inflates the effect of any single unusual shot; the defensive structure in front of the keeper across the season, since a newly reinforced back line changes the shot profile mid-season in ways a single seasonal average obscures; and whether the underperformance or overperformance is concentrated in a particular shot type, which points toward a specific, coachable technical gap rather than a general decline.
| Question | Why it matters |
|---|---|
| How many shots were actually faced? | Small samples exaggerate the effect of a single unusual shot |
| Did the defensive structure change mid-season? | A stronger or weaker back line changes the shot profile faced |
| Is the gap concentrated in one shot type? | Points to a specific technical issue rather than general form |
Distribution and sweeping: the parts neither number measures
A growing share of a modern goalkeeper’s value comes from actions no shot-stopping metric captures at all: accurate distribution under pressure to start attacks, sweeping behind a high defensive line to intercept through balls before they become shots, and commanding the box on crosses to prevent a chance from developing in the first place. A keeper who excels at these actions can suppress the quality and quantity of shots a team concedes overall, in a way that shows up in team-level defensive numbers rather than in any individual shot-stopping statistic.
Clubs building a genuinely rounded assessment of a goalkeeper increasingly track these actions separately, treating shot-stopping numbers, whether raw or adjusted, as only one part of a wider evaluation rather than the whole picture.
A practical reading order for scouts and fans alike
The most reliable approach starts with shot volume and defensive context, moves to the expected-goals-adjusted comparison rather than the raw save percentage, and only then layers in footage review to understand the specific technical habits behind any statistical gap. Skipping straight to the raw save percentage risks anchoring a judgement on the single number most distorted by circumstances entirely outside the keeper’s control.
This order applies whether the question is a transfer decision, a fan argument, or a coaching review, because the underlying distortion, save percentage rewards keepers behind good defenses regardless of who is asking the question, does not change based on the stakes of the conversation.
How much data is actually enough to trust either number
Post-shot expected goals models generally need a meaningful sample of shots faced before their season-long comparison becomes reliable, and a keeper who has played only a handful of matches, whether through injury, rotation or a mid-season transfer, should be judged with far more caution than the seasonal number alone suggests. Analysts commonly treat a keeper’s rolling total across multiple seasons as more informative than any single partial campaign, precisely because shot quality faced varies so much match to match.
This caution applies doubly to a young keeper making a step up in level, since a small sample at a new, higher standard of competition tells a recruiter far less than the same sample size would at a level the keeper has already played extensively.
What commentators usually get wrong on broadcast
Save percentage remains the number most often cited during a live broadcast specifically because it needs no further explanation for a casual audience, and commentators reaching for it in the moment rarely have the shot-by-shot context available to caveat it properly on air. This gap between broadcast-friendly simplicity and analytical accuracy is unlikely to close soon, since the alternative requires explaining a probabilistic model in real time to an audience that mostly wants a quick, digestible verdict.
Recognising this gap is useful mainly as a caution for viewers: a pundit’s confident claim about a keeper’s form based on a single raw percentage is worth treating as a starting point for further checking, not as the finished analysis it is often presented as.
Frequently Asked Questions
Why does save percentage reward keepers behind good defenses?
A strong defence suppresses high-quality chances, leaving mostly low-probability shots that inflate a keeper’s save percentage regardless of their individual shot-stopping skill.
What does goalkeeper post shot xg actually measure?
It compares goals conceded against the modelled probability of each shot faced being scored, showing whether a keeper is over- or under-performing relative to shot quality.
Is post-shot expected goals a perfect fix?
No. It still struggles with deflected shots, unusual angles, and small sample sizes, all of which can distort a single season’s comparison.
What should be checked before judging a keeper on save percentage alone?
Total shots faced, whether the defensive structure changed mid-season, and whether any underperformance is concentrated in a specific shot type.
Do these metrics capture a goalkeeper’s distribution and sweeping ability?
No. Both save percentage and post-shot expected goals measure shot-stopping only, leaving distribution, sweeping and command of the box to separate assessment.
A single clean sheet tells a crowd everything it wants to know that day. It tells a recruitment department almost nothing until the shots behind it are counted properly.